Application Mastery
Read at your own pace. Code execution, quizzes, progress tracking, and the AI tutor are available in the interactive view with JavaScript enabled.
Your Application Bridge
From learning pieces to making predictions
Now that you've completed Fundamental Understanding and Skill Development, you have the ingredients:
- data as rows and feature vectors
- careful transformations
- readable Python functions
- the basic ML loop
In this lesson, Application Mastery, we start using those ingredients for predictive analytics: taking known examples, learning a useful pattern, and checking whether that pattern helps on data the model has not seen.
We are not building the full final project yet. That comes next in Project Execution. Here, the goal is to practice the core habit: turn a question into a prediction workflow you can trust.

Prediction Workflow
The application mindset
Predictive analytics is less about saying “I used a model” and more about asking:
Did this model make better predictions than a simple alternative?
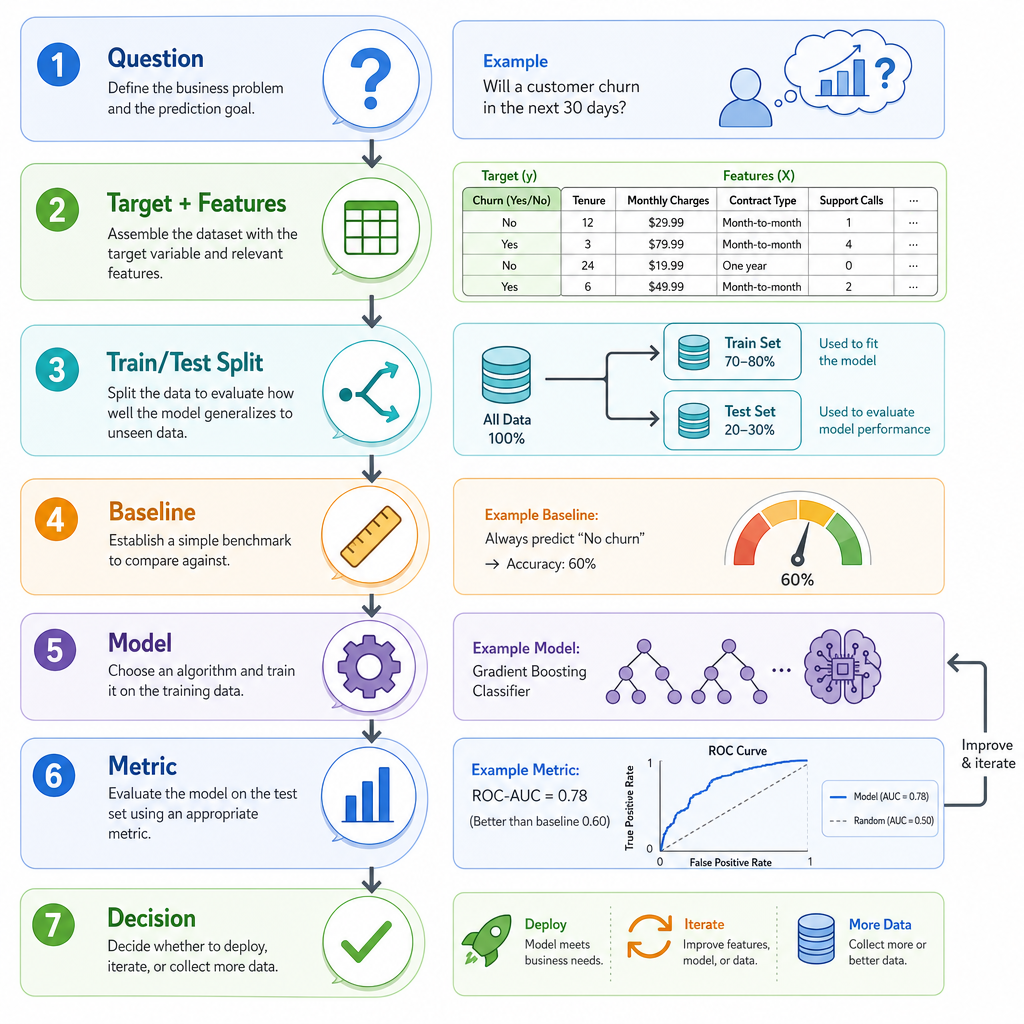
A practical workflow looks like this:
Question
   ↓
Target + features
   ↓
Train/test split
   ↓
Baseline
   ↓
Model
   ↓
Metric
   ↓
Decision
Each step protects you from a common mistake. For example, the baseline prevents you from being impressed by a model that is actually worse than a simple guess.
Frame The Task
You have apartment data with columns: size_sqft, bedrooms, neighborhood_score, and monthly_rent.
You want to predict rent for new apartments.
Which setup best frames the prediction task?
Mini Prediction Data
Rows become a prediction problem
In Skill Development, you practiced turning rows into structured data. Now we add a predictive purpose.
Below, each row describes a small home sale. The feature is size_sqft, and the target is price_k, meaning sale price in thousands of dollars.
This is intentionally tiny so you can focus on the workflow instead of library details.
```python
homes = [
    {"size_sqft": 650, "price_k": 205},
    {"size_sqft": 800, "price_k": 225},
    {"size_sqft": 900, "price_k": 250},
    {"size_sqft": 1050, "price_k": 265},
    {"size_sqft": 1200, "price_k": 300},
    {"size_sqft": 1350, "price_k": 335},
    {"size_sqft": 1500, "price_k": 360},
]

features = [row["size_sqft"] for row in homes]
targets = [row["price_k"] for row in homes]

print("First row:", homes[0])
print("Features:", features)
print("Targets:", targets)
```
Baselines Matter
Before modeling, make a simple guess
A baseline is a simple prediction you compare your model against.
For a numeric prediction, a common baseline is:
Always predict the average target value from the training data.
This is not meant to be impressive. It is meant to be honest. If your model cannot beat this, the model is not adding useful predictive value yet.
```python
train_prices = [205, 225, 250, 265, 300]
test_prices = [335, 360]

baseline_prediction = sum(train_prices) / len(train_prices)
absolute_errors = [abs(actual - baseline_prediction) for actual in test_prices]
mae = sum(absolute_errors) / len(absolute_errors)

print("Baseline prediction:", round(baseline_prediction, 2))
print("Test prices:", test_prices)
print("Absolute errors:", [round(error, 2) for error in absolute_errors])
print("Baseline MAE:", round(mae, 2))
```
Baseline Check
True or false:
A baseline is useful even when it is very simple, because it gives your model something concrete to beat.
Fit A Pattern
A small model, evaluated honestly
Now we fit a simple line using only the training rows, then evaluate it on the test rows.
You do not need to memorize the formula here. Focus on the application pattern:
- learn from training data
- predict on test data
- compare against the baseline using the same metric
```python
def fit_line(xs, ys):
    mean_x = sum(xs) / len(xs)
    mean_y = sum(ys) / len(ys)

    numerator = sum((x - mean_x) * (y - mean_y) for x, y in zip(xs, ys))
    denominator = sum((x - mean_x) ** 2 for x in xs)

    slope = numerator / denominator
    intercept = mean_y - slope * mean_x
    return slope, intercept

train_sizes = [650, 800, 900, 1050, 1200]
train_prices = [205, 225, 250, 265, 300]

test_sizes = [1350, 1500]
test_prices = [335, 360]

slope, intercept = fit_line(train_sizes, train_prices)
model_predictions = [slope * size + intercept for size in test_sizes]

baseline_prediction = sum(train_prices) / len(train_prices)
baseline_predictions = [baseline_prediction for _ in test_sizes]

def mean_absolute_error(actuals, predictions):
    errors = [abs(actual - pred) for actual, pred in zip(actuals, predictions)]
    return sum(errors) / len(errors)

model_mae = mean_absolute_error(test_prices, model_predictions)
baseline_mae = mean_absolute_error(test_prices, baseline_predictions)

print("Model equation: price_k =", round(slope, 3), "* size_sqft +", round(intercept, 2))
print("Model predictions:", [round(p, 2) for p in model_predictions])
print("Actual prices:", test_prices)
print("Model MAE:", round(model_mae, 2))
print("Baseline MAE:", round(baseline_mae, 2))
print("Model beat baseline?", model_mae < baseline_mae)
```
Name The Metric
Fill in the blank with the common acronym:
The metric that averages the absolute sizes of prediction errors is called ___.
Fill in the blank: _____________
Read The Results
What the numbers are telling you
A model result is not just a score. It is evidence.
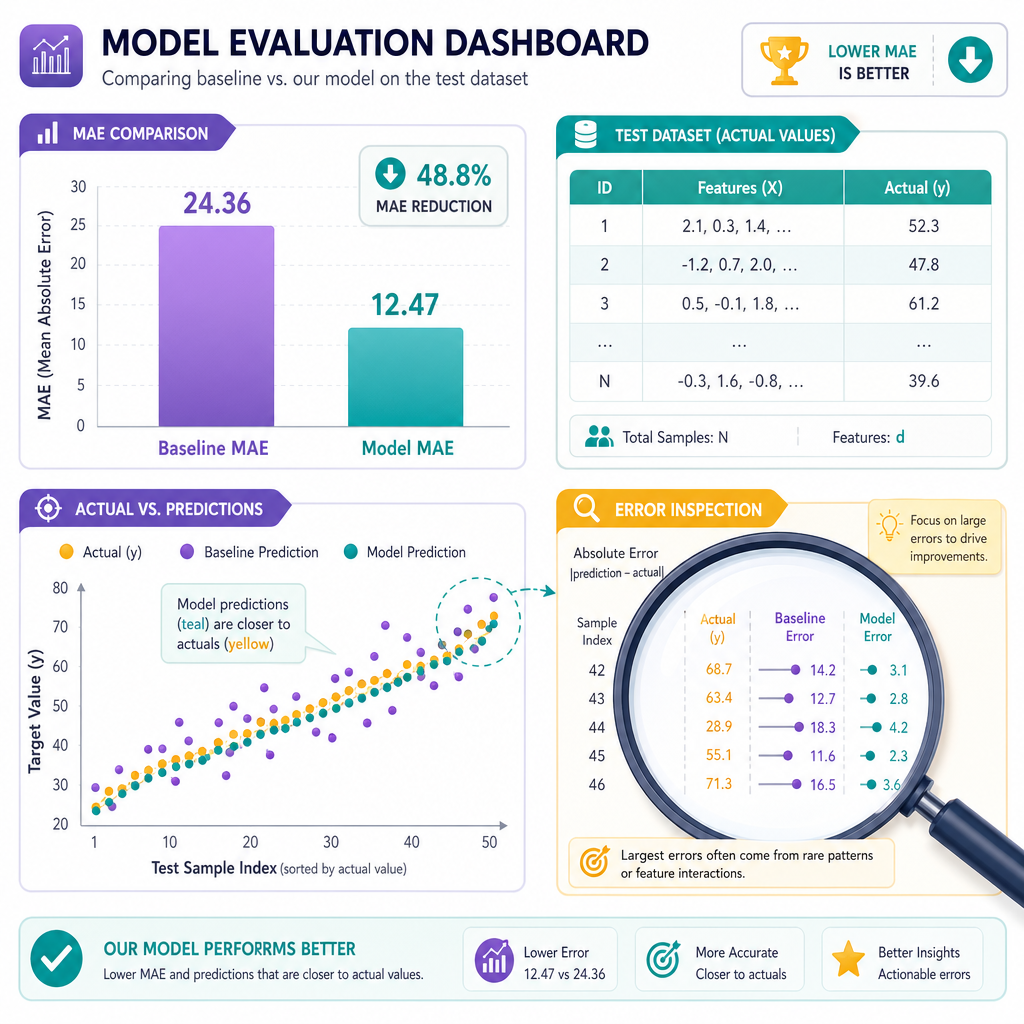
When you compare model MAE against baseline MAE, ask:
- Did the model improve predictions? Lower error is better for MAE.
- Is the test set separate from training? If not, the score can be overly optimistic.
- Do the errors make sense? A few strange misses can reveal missing features.
- Is the target useful? Predicting the wrong thing well is still the wrong goal.
This is the heart of application mastery: using metrics to guide your next move instead of guessing.
Pick Next Step
Suppose your model has a higher MAE than the baseline on the test set.
What is the best next step?
Application Checklist
Your predictive analytics checklist
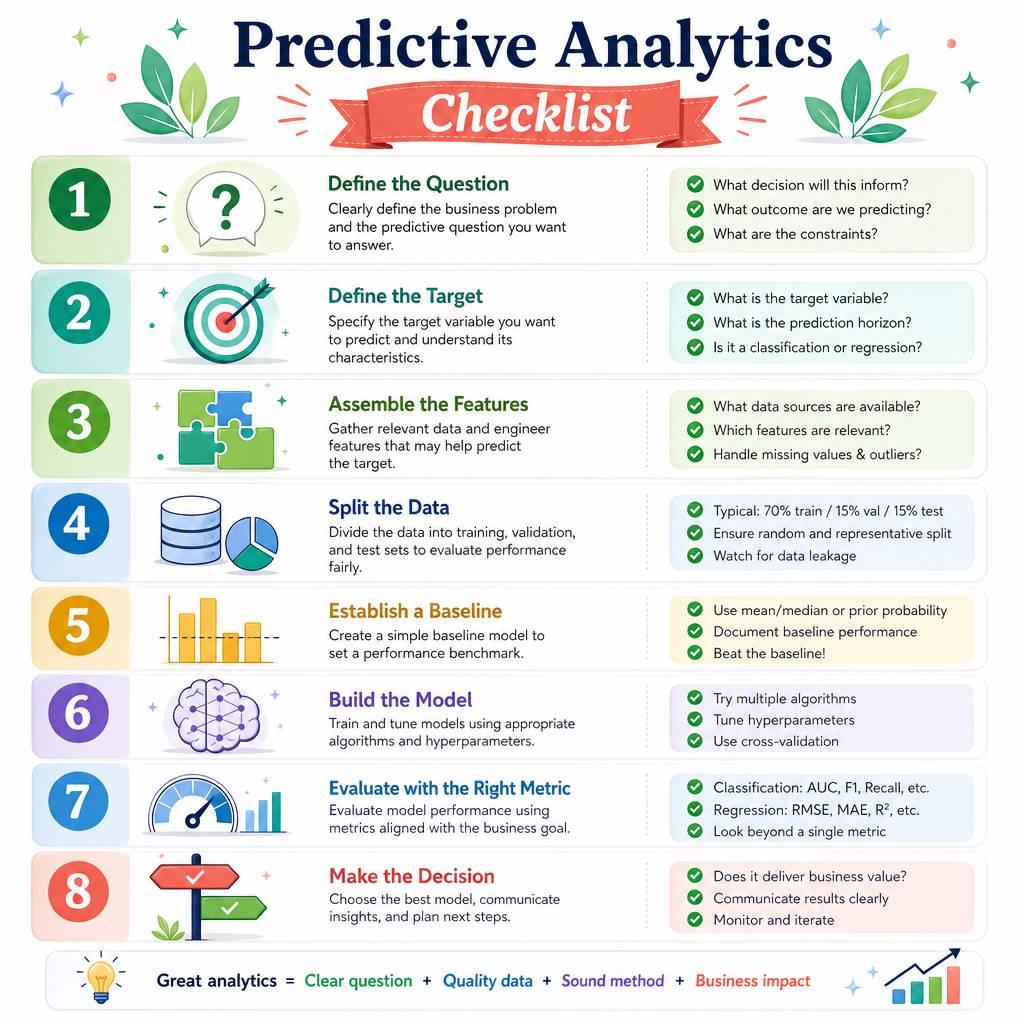
You can now apply a compact version of the ML loop:
1. State the prediction question.
2. Identify the target.
3. Choose usable features.
4. Split training and test data.
5. Build a simple baseline.
6. Fit a model on training data.
7. Evaluate with a clear metric.
8. Decide what the result means.
That is the practical foundation for predictive analytics. In Project Execution, you will use this checklist to build a more complete predictive model from start to finish.