Introduction to Statistics - Using Bubbles
Read at your own pace. Code execution, quizzes, progress tracking, and the AI tutor are available in the interactive view with JavaScript enabled.
Welcome, Bubble Scientist
Why statistics matters
In Introduction to Numbers and Counting, you learned that numbers name amounts. In Shapes and Patterns, you saw that objects can have features like shape. In Addition and Subtraction, amounts changed. In Understanding Multiplication and Division, groups could be shared fairly.
Now we are ready for a new superpower: statistics.
Statistics means: using numbers to understand a group of things.
Today our group of things is a bunch of bubbles:
- Some bubbles are tiny.
- Some are huge.
- Some are the same size.
- We want to learn what the whole bubble group is like.
That is exactly what data scientists do, except their “bubbles” might be customers, pictures, cars, phones, hospital visits, or robot sensor readings.

Bubbles Become Data
One bubble = one data point
A data point is one little piece of information.
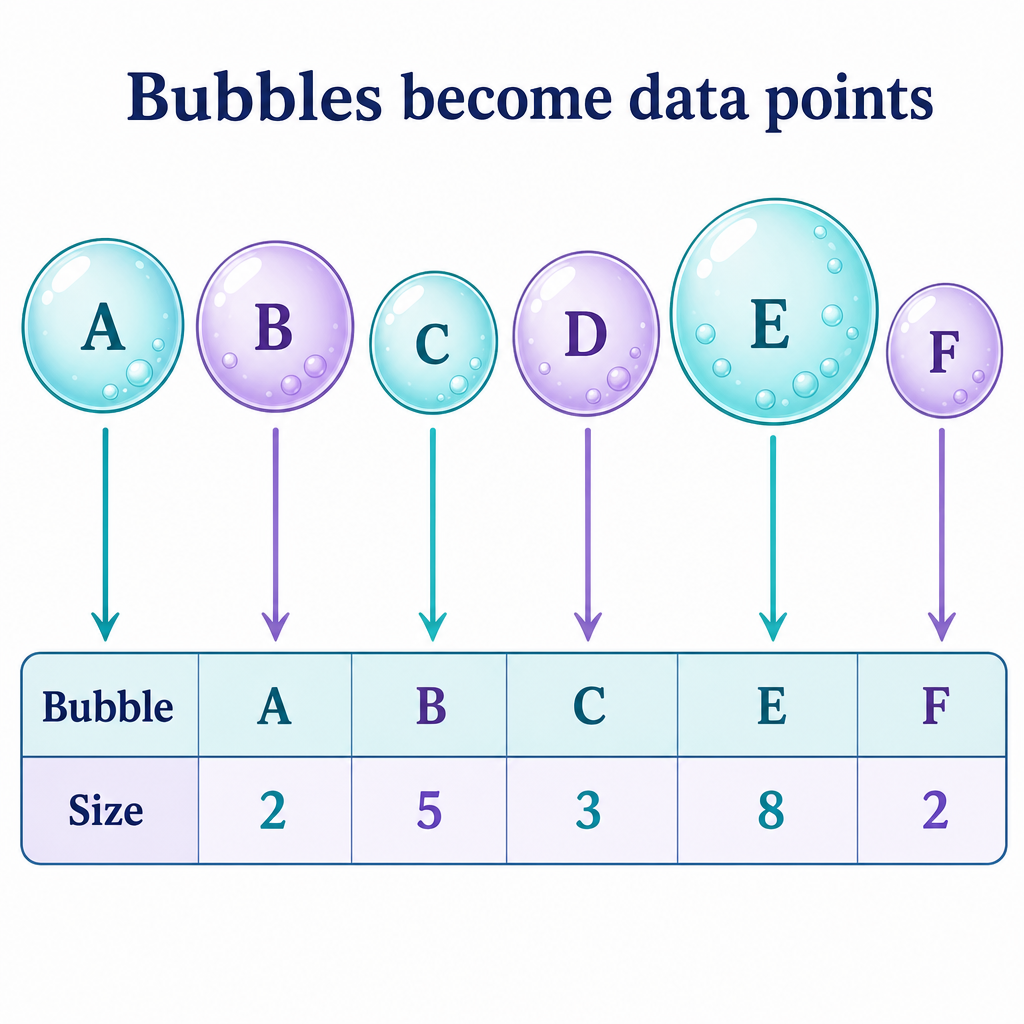
If we look at 6 bubbles and write down their sizes, we have 6 data points.
Bubble:   A   B   C   D   E   F
Size:     2   5   3   5   8   2
Here, the size numbers are our data.
We are not just staring at one bubble. Statistics asks questions about the whole group:
- How many bubbles are there?
- What size is common?
- What size feels typical?
- Are the bubbles all similar, or very different?
A computer can answer these questions quickly when we store the numbers carefully.
Pick The Data
A scientist watches bubbles and writes down only one thing about each bubble: its size.
Which list is the best example of the bubble size data?
Python Holds Bubbles
A list is like a bubble tray
In Python, a list can hold many values in order.
For our bubble sizes, the list is like a tray holding all the measurements.
We can ask Python:
- How many bubble sizes are in the list?
- What is the total size if we add them?
- What are the smallest and biggest bubbles?
These are tiny statistics steps.
```python
bubble_sizes = [2, 5, 3, 5, 8, 2]

print("Bubble sizes:", bubble_sizes)
print("Number of bubbles:", len(bubble_sizes))
print("Total of sizes:", sum(bubble_sizes))
print("Smallest bubble:", min(bubble_sizes))
print("Biggest bubble:", max(bubble_sizes))
```
The Typical Bubble
Average means fair-share size
A useful statistics idea is the average, also called the mean.
The average asks:
If all the bubble size were shared fairly, what size would each bubble get?
This connects to the fair sharing idea from Understanding Multiplication and Division.
Formula:
average = total size / number of bubbles
For bubble sizes:
2, 5, 3, 5, 8, 2
The total is 25, and there are 6 bubbles. The average is about 4.17.
That does not mean every bubble is size 4.17. It means 4.17 is a helpful “typical” size for the group.
```python
bubble_sizes = [2, 5, 3, 5, 8, 2]

total = sum(bubble_sizes)
count = len(bubble_sizes)
average = total / count

print("Total size:", total)
print("Number of bubbles:", count)
print("Average bubble size:", average)
```
Find The Range
The range tells how far apart the smallest and biggest values are.
range = biggest - smallest
For these bubble sizes:
3, 4, 9, 6
What is the range?
Fill in the blank: _____________
How Spread Out
Same average, different feeling
Statistics is not only about the average.
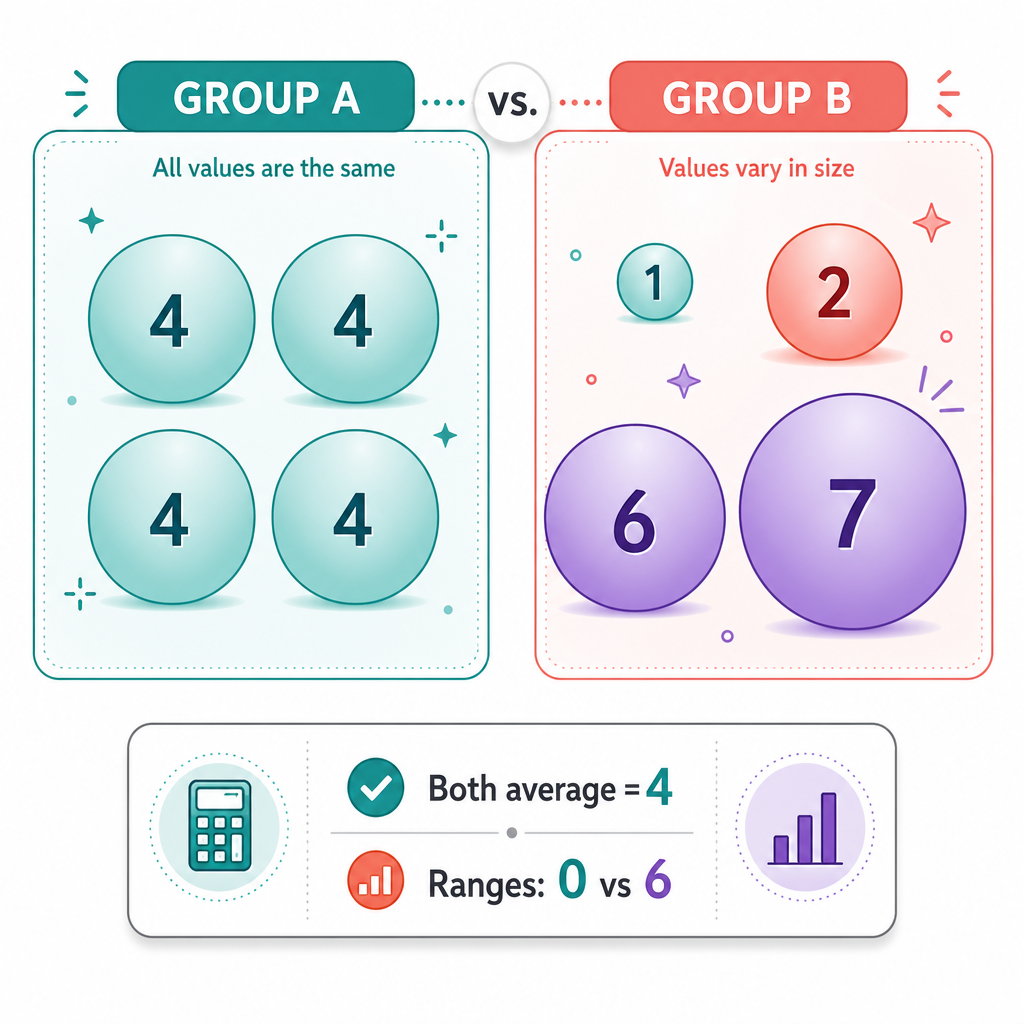
Look at these two bubble groups:
Group A: 4, 4, 4, 4
Group B: 1, 2, 6, 7
Both groups have average 4.
But they feel very different:
- Group A bubbles are all the same size.
- Group B bubbles are spread out: some small, some large.
The range helps us notice this.
Group A range = 4 - 4 = 0
Group B range = 7 - 1 = 6
So the range is a simple way to ask: Are the values close together or far apart?
Average Check
True or false?
If two bubble groups have the same average, then every bubble in both groups must be the same size.
Most Common Size
Counting repeated bubbles
Sometimes we want to know which size appears most often.
This is called the mode.
If many bubbles are size 5, then size 5 might be the mode.
A mode is useful when the “most common thing” matters:
- most common shoe size
- most common button clicked
- most common color in a picture
- most common bubble size
Python can count how often each size appears.
```python
from collections import Counter

bubble_sizes = [2, 5, 3, 5, 8, 2, 5]
counts = Counter(bubble_sizes)
mode_size = counts.most_common(1)[0][0]
mode_count = counts.most_common(1)[0][1]

print("Bubble sizes:", bubble_sizes)
print("Counts for each size:", counts)
print("Most common size:", mode_size)
print("It appears this many times:", mode_count)
```
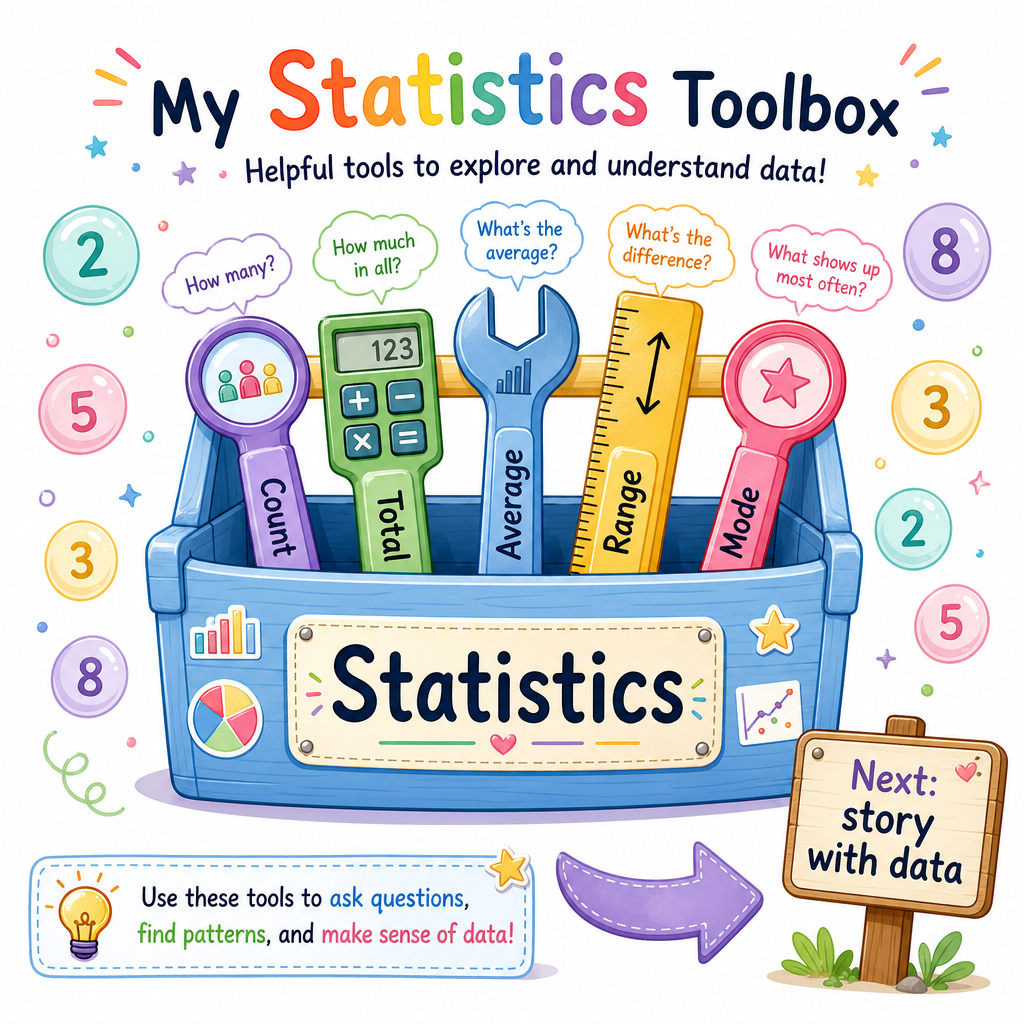
Statistics Toolbox
What you learned
Today, bubbles helped us meet statistics.
You learned that:
- A data point is one piece of information.
- A list of bubble sizes is a small dataset.
- Count tells how many data points we have.
- Total adds the values.
- Average / mean gives a fair-share typical value.
- Range tells how spread out the values are.
- Mode tells the most common value.
These tools are small, but powerful. Data scientists and AI engineers use these same ideas before building bigger models.
Next, we will learn how to use data to explain what is happening, like turning bubble numbers into a clear little story.