

Libraries
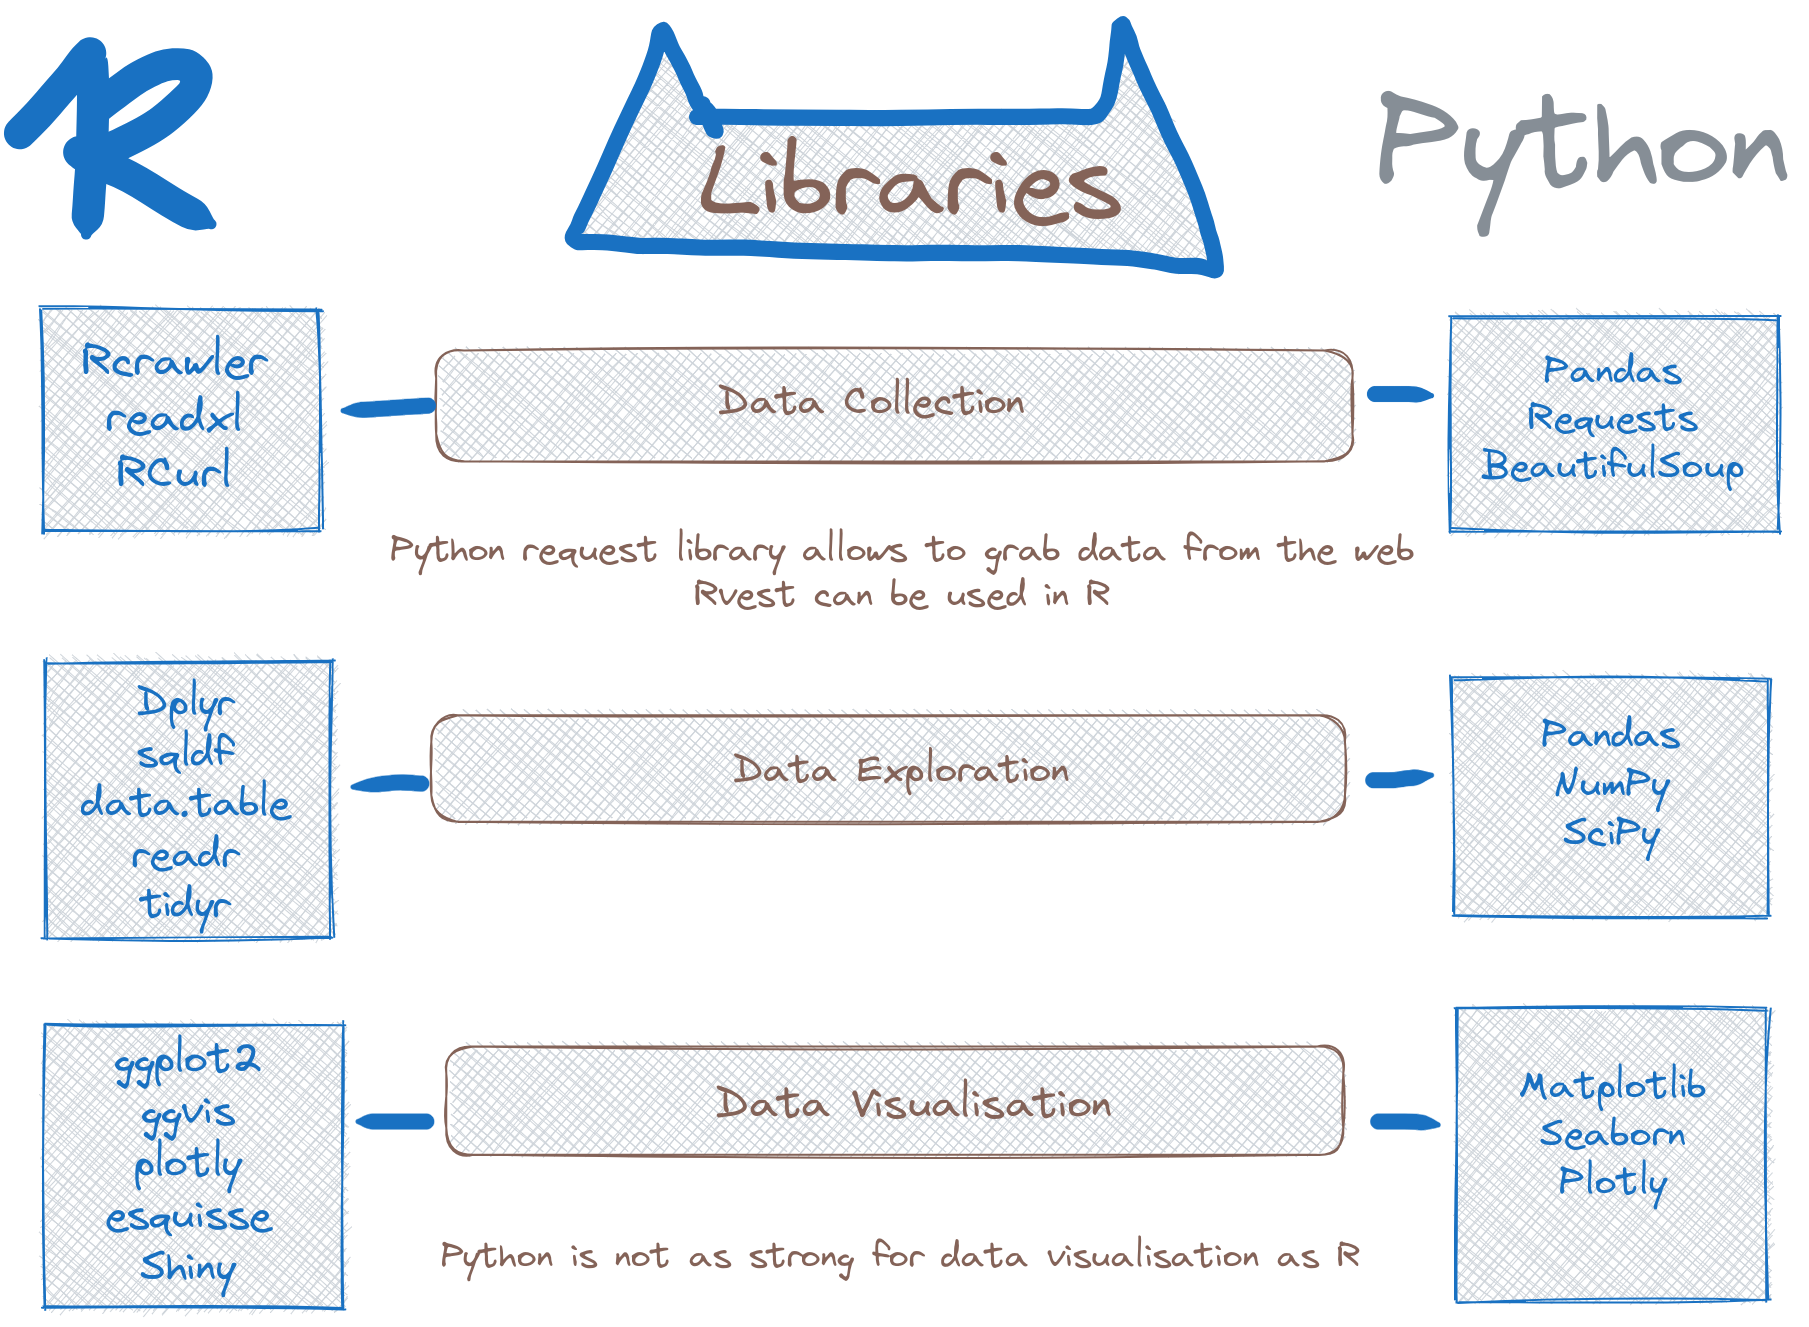
Data Collection
R supports Excel, CSV and text files, as well as files built in Minitab or in SPSS format.
Python in comparison supports all kinds of data formats, from CSV files to JSON sourced from the web, and SQL tables. Python's request library allows you to easily grab data from the web, although modern R packages like Rvest can be used for basic web scraping.
Data Wrangling/Exploration
R allows you to build probability distributions, apply different statistical tests, and use standard ML and data mining techniques. It is optimized for statistical analysis of large datasets, and it offers a number of different options for exploring data.
Python in comparison allows you to explore data with the data analysis library Pandas. With this library you can filter, sort and display data in a matter of seconds.
Data Visualization
Since R was built to demonstrate the results of statistical analysis, you can easily create basic charts and plots with the base graphics module. Using the library ggplot2 more advanced plots can be created, such as complex scatter plots with regression lines.
Python in comparison is not as strong for data visualization. The Matplotlib library for generating basic graphs and charts. The Seaborn library allows you to draw more attractive and informative statistical graphics in Python.
